
alvaModel is a software tool to create Quantitative Structure Activity/Property Relationship (QSAR/QSPR) models. These models can be used to predict the biological, physicochemical and environmental properties of chemicals (Mauri, A., & Bertola, M. (2022). Alvascience: A New Software Suite for the QSAR Workflow Applied to the Blood–Brain Barrier Permeability. International Journal of Molecular Sciences, 23(21), 12882. https://doi.org/10.3390/ijms232112882).
Build and Deploy
Alvascience’s solution to build and deploy QSAR/QSPR regression and classification models consists of two pieces of software: alvaModel and alvaRunner. The latter is a software tool that allows you to apply the models, created using alvaModel, on a new set of molecules without the need of any other software tool, demonstrated in the picture below:
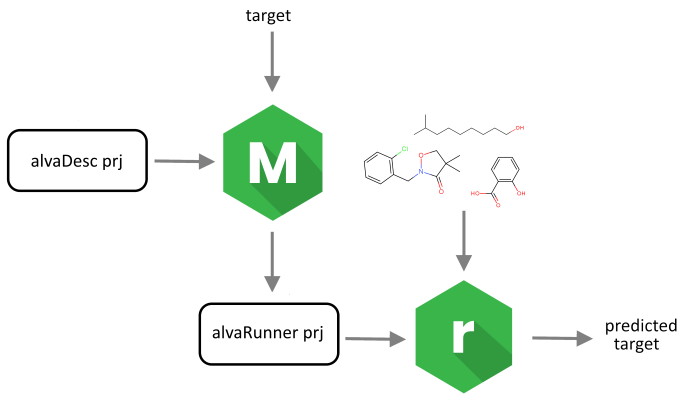
This solution separates the training of the models from their deployment. Therefore, it allows you to deploy your models to other parties (e.g., if you want to make them available to prove their reproducibility) or to use models created by others (e.g., if you want to test a model described in a scientific paper).
Using alvaModel you can train QSAR/QSPR regression and classification models using the descriptors and fingerprints previously calculated in alvaDesc. The target variable you want to predict can be imported from an external text file.
Graphical user interface
An easy to use GUI allows you to create your models:
Using a simple step-by-step procedure (wizard) you can create models selecting the descriptors and fingerprints you want to use.
Feature selection using Genetic Algorithms
Since the number of descriptors in a alvaDesc project can be quite big (up to 5000), alvaModel can perform a feature selection, based on Genetic Algorithms, in order to find the best models according to a defined score (e.g., R2, Q2, RMSE).
Feature reduction
Several feature reduction tools can be used to reduce the number of descriptors to train your model with (e.g., Constant values, Standard deviation, Pair correlation).
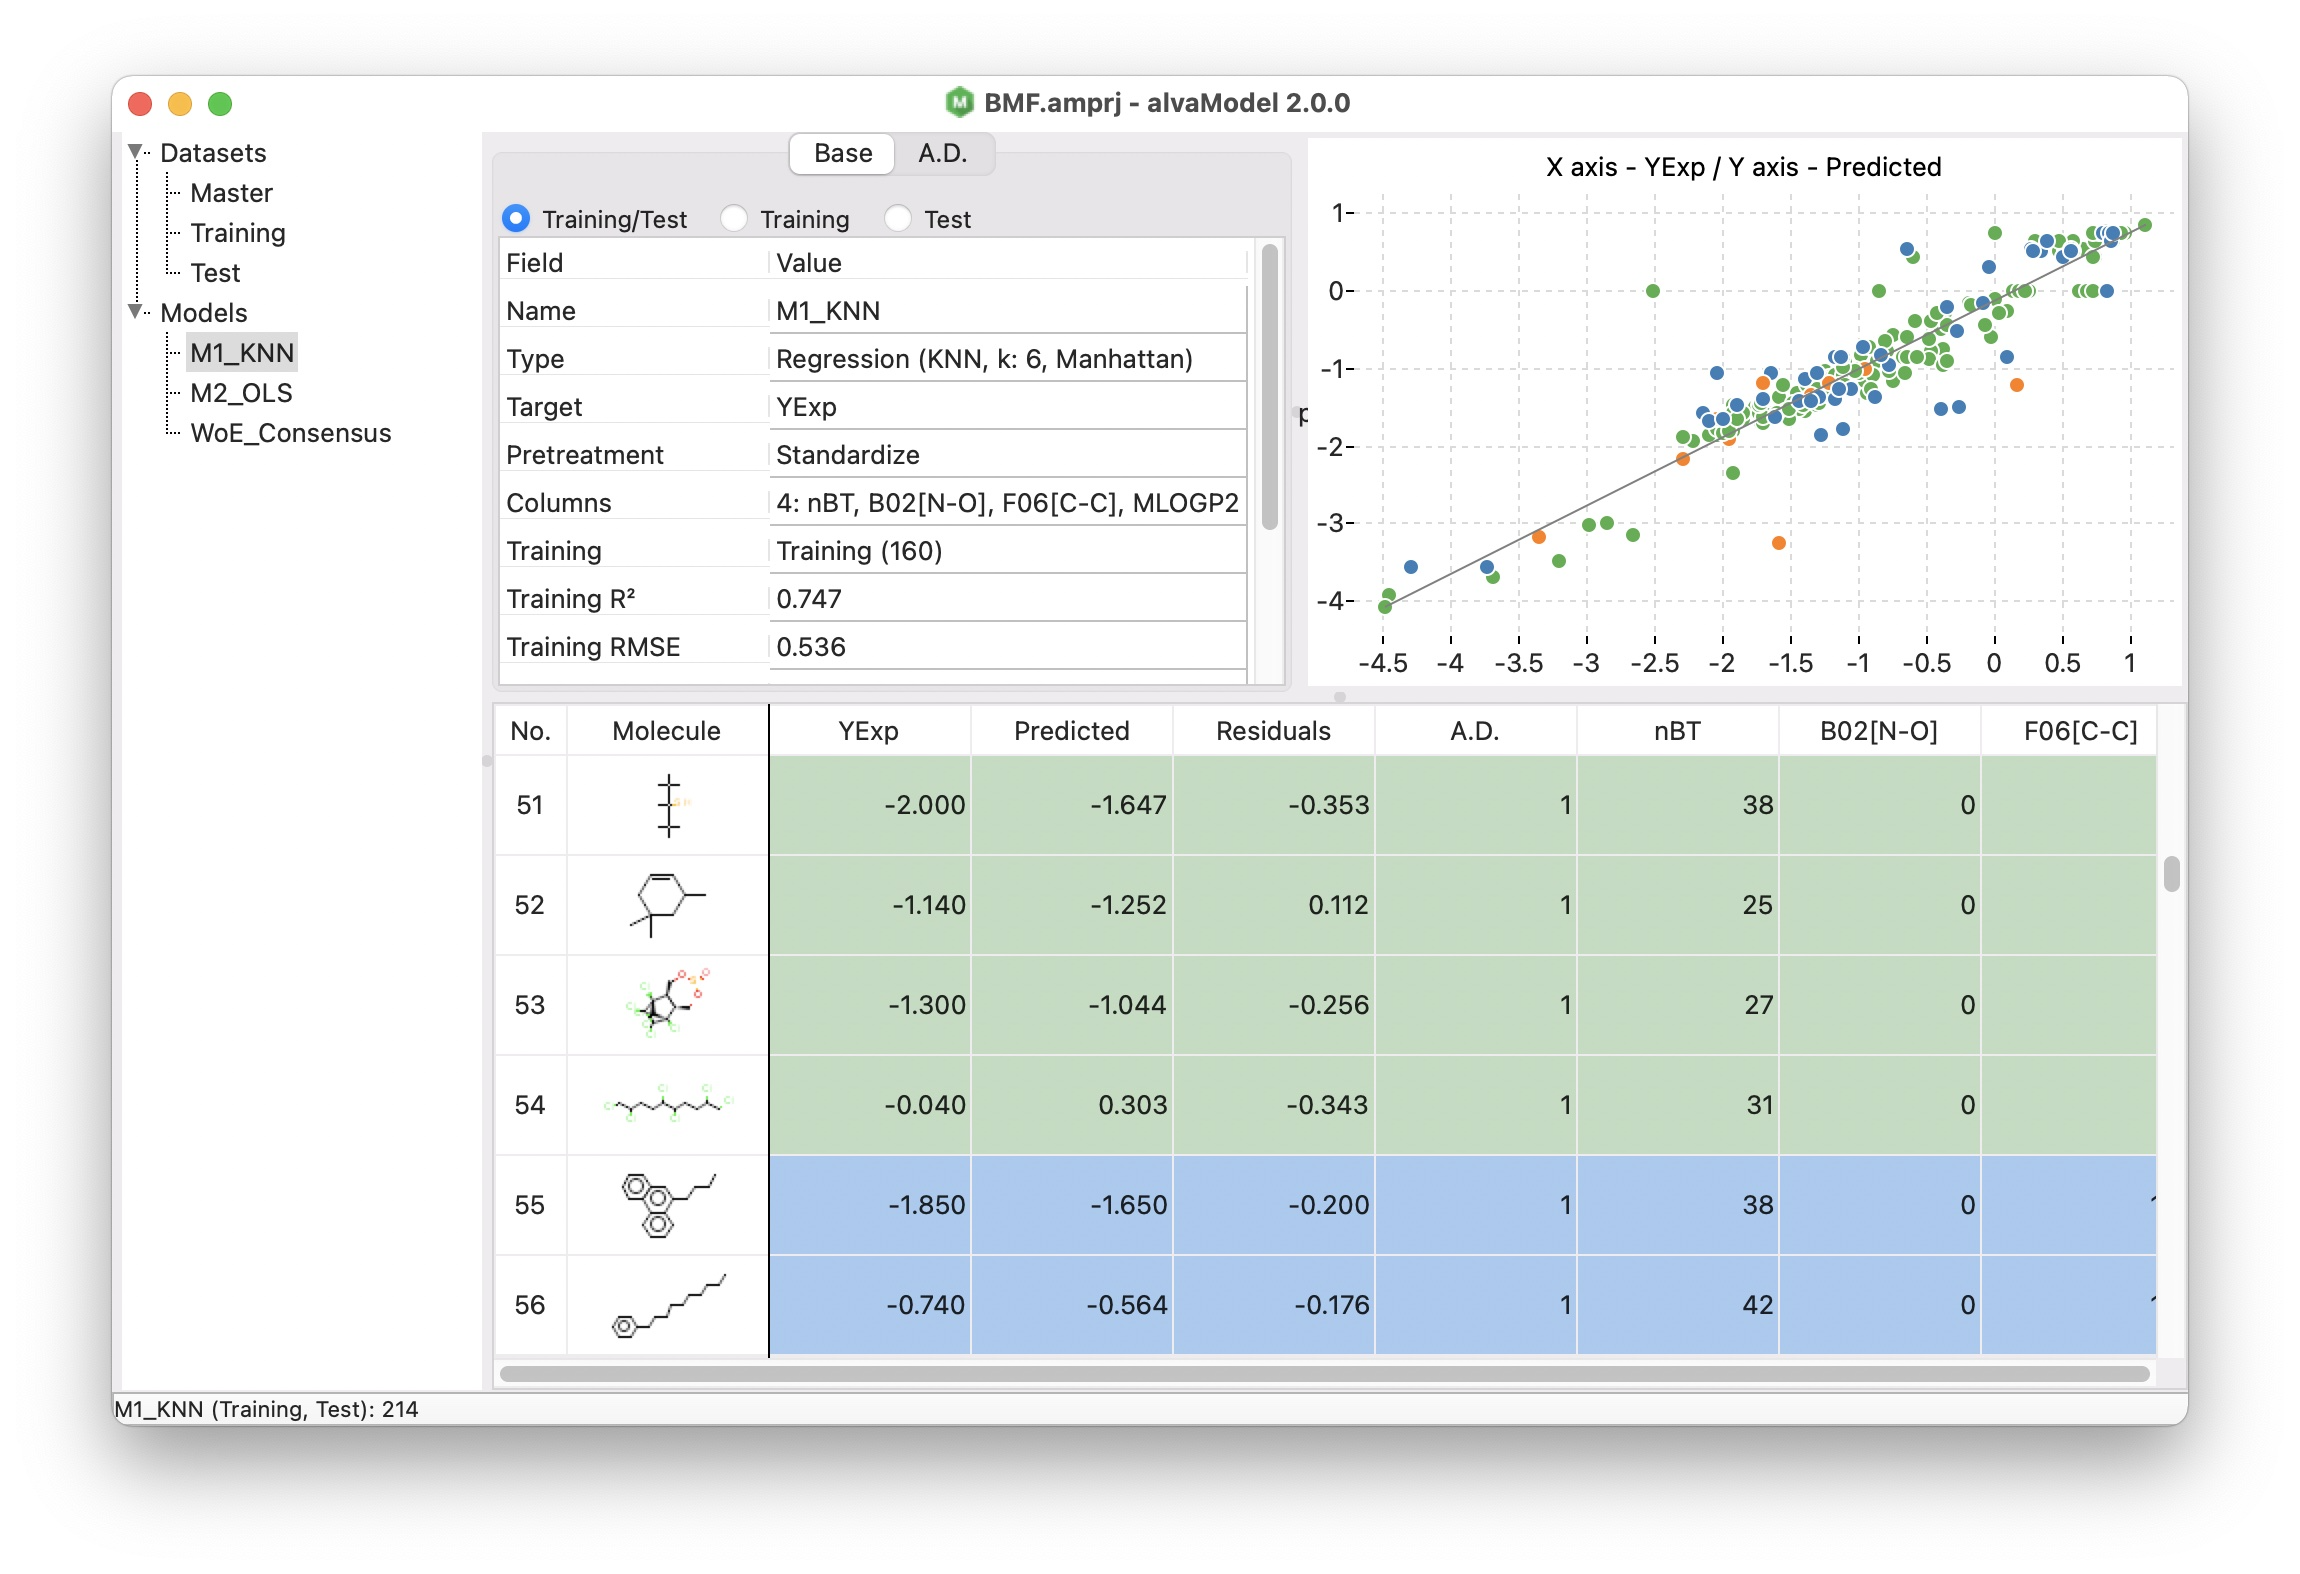
Regression model
Different regression model types are available:
- Ordinary Least Squares (OLS) model
- Partial Least Squares (PLS) model
- KNN regression model
- Support Vector Machine (SVM) model
- Consensus model defined as the arithmetic mean of the values predicted by the selected models
Classification model
Different binary classification model types are available:
- Linear and Quadratic Discriminant Analysis (LDA/QDA) model
- Partial Least Squares Discriminant Analysis (PLS-DA) model
- KNN classification model
- Support Vector Machine (SVM) model
- Consensus model defined assigning the class based on the majority of the values predicted by the selected models
Applicability Domain
The model’s Applicability Domain can be estimated by measuring the similarity among the training dataset and the given molecules. An in/out indication shows whether a molecule lies inside or outside the Applicability Domain.
The Applicability Domain methods available are Distance-based (e.g., Average distance) and Leverage (which use the so called Hat Matrix).
Charts
Each model can be analysed by using one of the available charts:
- scatter plot of experimental and predicted values (for regression models)
- residual plot (for regression models)
- beta bars plot (for OLS and PLS regression models)
- Williams plot (for regression models based on descriptors)
- histograms for experimental, predicted and residual values as well for the descriptors used in the model
Prediction analysis
alvaModel provides a functionality to evaluate a single prediction through a graphical interface called prediction detail.
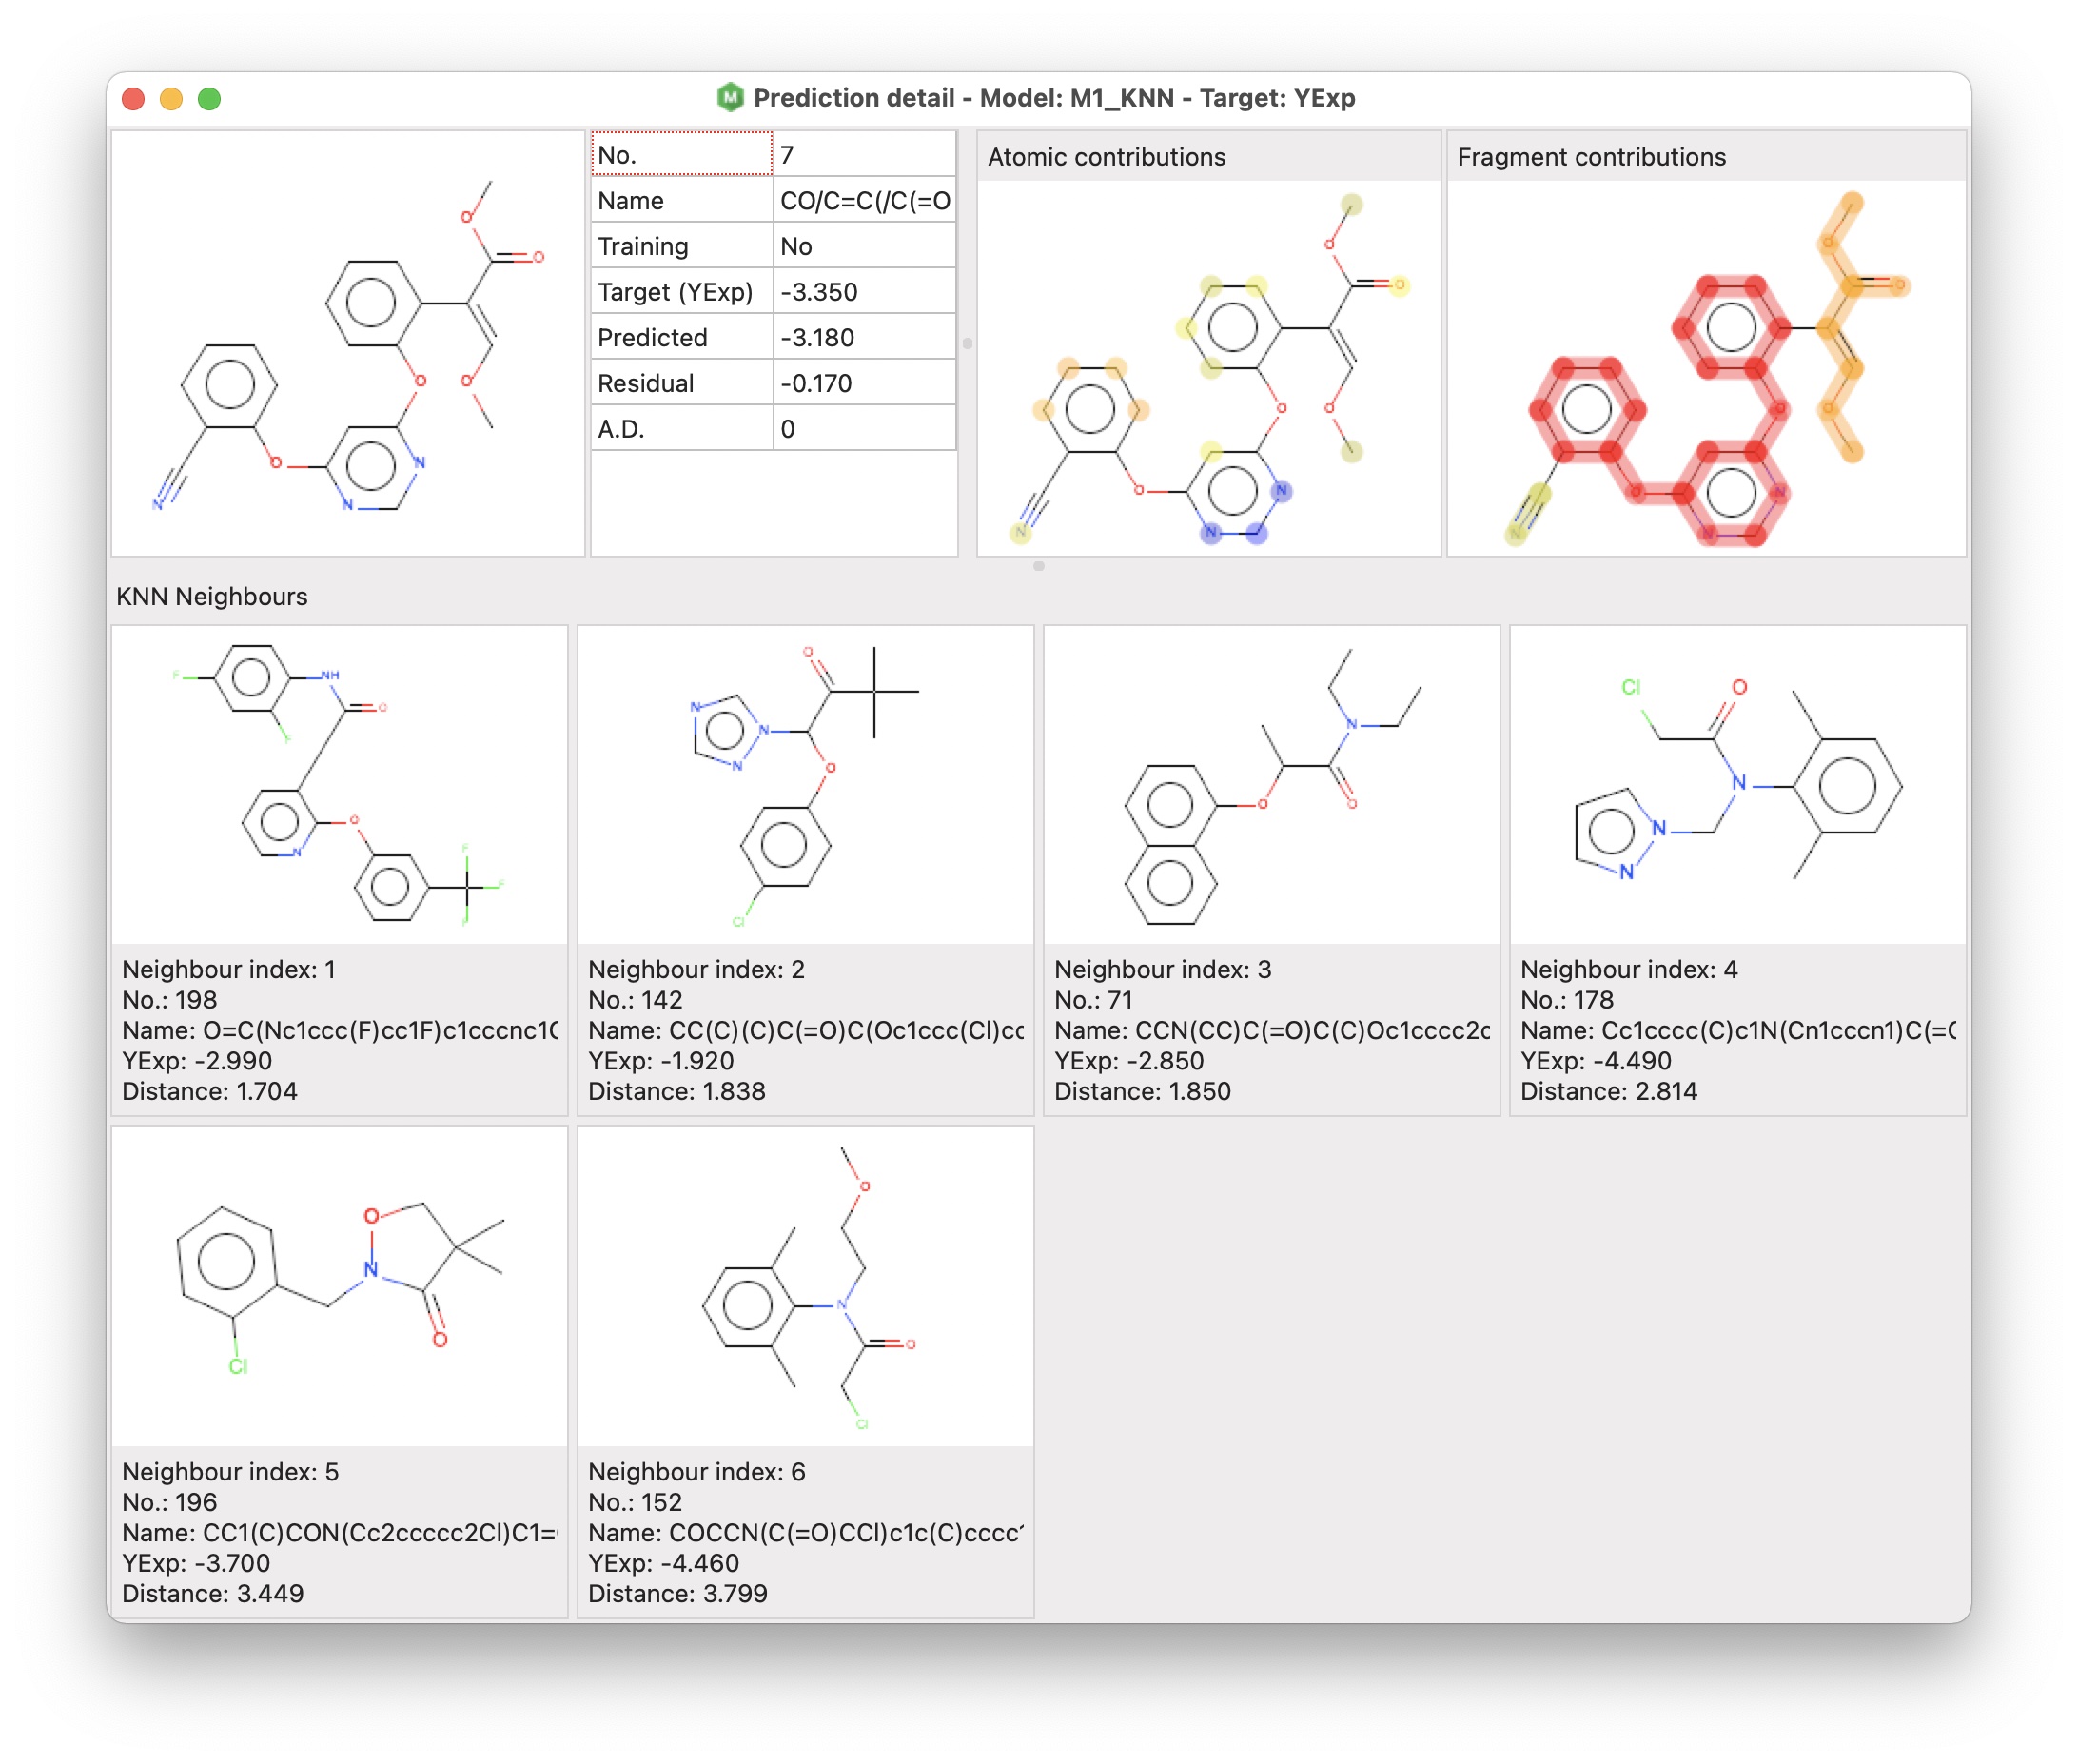
The prediction detail window includes three different sections:
- the target molecule and a grid including some information about the prediction
- atomic and fragment contributions (for all regression models except the consensus ones)
- KNN neighbours (for KNN models)
The atomic and fragment contributions are two visual representations of the contribution of atoms for the Atomic contributions, and framework and side chains for the Fragment contributions (Polishchuk, P. G., Kuz’min, V. E., Artemenko, A. G., & Muratov, E. N. (2013). Universal Approach for Structural Interpretation of QSAR/QSPR Models. Molecular Informatics, 32(9–10), 843–853. https://doi.org/10.1002/minf.201300029 – Riniker, S., & Landrum, G. A. (2013). Similarity maps – a visualization strategy for molecular fingerprints and machine-learning methods. Journal of Cheminformatics, 5(1), 43. https://doi.org/10.1186/1758-2946-5-43).
Video
A short video introduction:
Examples
A few example models were prepared using alvaModel and they can be applied to your molecules by using alvaRunner.
Platforms
The software is 64bit and it’s available for Windows, Linux and macOS.
Related tools
- A key input of the software is a project created using alvaDesc
- The models can be exported in a project which can be applied on a new set of molecules using alvaRunner
- alvaRunner can be integrated with KNIME using alvaRunner Plugin
- A tutorial showing how to build a QSAR model using Alvascience tools